


Sustainability and Logistics - The CO2 Share of Logistics
How large is the CO2 share of logistics? An attempt at an answer that is not entirely straightforward.
In a nutshell: More and more goods are being shipped, flown or transported by truck around the world. Transport costs are lower than ever before. Not infrequently, transport costs account for 10% of a product's total costs – but in most cases they are even below that (averaging 1–3%). The continuously growing logistics sector also increases overall traffic volumes, which is perceptible to all of us on roads and highways, but also on rail, in aviation and in shipping. Global freight transport has now become one of the most significant CO2 emitters worldwide. But just how large is logistics' share of this?
The Challenge: Logistics as a Cross-Cutting Function Across All Areas and Phases of the Value and Supply Chain
The question is not so easy to answer, because logistics is a function that cuts across all areas and phases of the supply and value chain. The analyses commonly used are mostly based on the grouping/categorisation of sectors (emissions per sector), raw materials (emissions from cement, steel, etc.) or nations (emissions per country) including inhabitants (emissions per capita). And yes: there are many more groupings and categorisations.
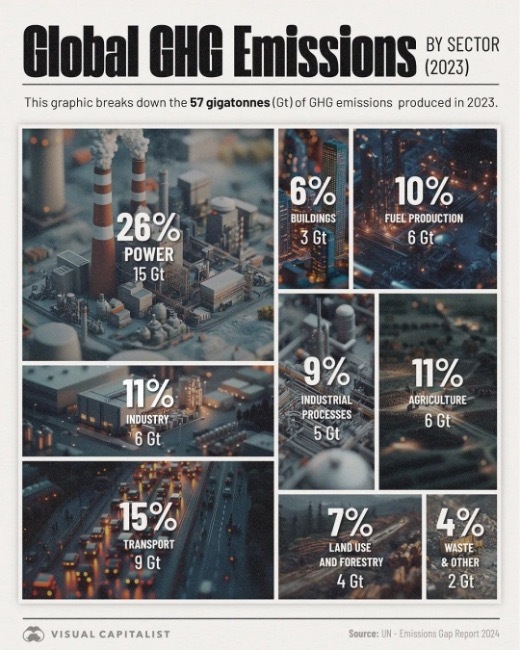
This leads to the following problems. When looking at all sectors, as Our World in Data or Visual Capitalist have done, for example, the CO2 share of logistics – excluding transport – is hidden within the sectors themselves. The transport figures, in turn, include private journeys (car travel, flights, etc.), which must be subtracted to isolate the logistics share of transport emissions. Furthermore, emissions arising from the heating and energy requirements of intralogistics properties (e.g. warehouses) are variously included in building emissions.

If we want to determine the share attributable to logistics across all disciplines, we need to piece this together.
Disclaimer: I am fully aware that piecing together all the various studies and reports is no easy task and will, moreover, be open to debate at one point or another. This is not a scientific paper or meta-study. My aim in this analysis is to convey fundamental statements (e.g. rail is better than aviation when it comes to emissions) rather than to precisely determine percentage and absolute emissions figures. I therefore ask every reader to view the figures with an implied margin of variance in mind.
So let us begin.
Globally, we emit approximately 57 billion tonnes¹ (= 57 Gt) of greenhouse gases per year. [12]
Transport in General
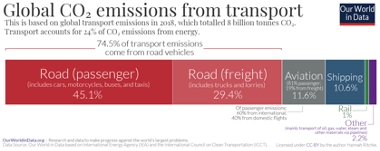
The transport sector is the fastest-growing source of CO2 emissions worldwide. Just under 15% of global greenhouse gases are emitted by transport. That amounts to around 9 billion tonnes¹ (= 9 Gt) of CO2 per year. [12] This figure is currently rising by 2.5% annually. [2] Road transport (passenger and freight) accounts for 74.5%² of total transport emissions, making it a significant climate factor, with passenger transport (cars, taxis, buses, motorcycles) carrying the lion's share – nearly half of that total. [2]
In Germany, the transport sector released 146 million tonnes of CO2 emissions into the atmosphere in 2023, corresponding to 22% of the country's total CO2 output. This share of total emissions has risen by 9% compared to 1990. [8]
Incidentally: In 2016, 63 billion litres of petrol and diesel were consumed in Germany. That is equivalent to 86 swimming pools' worth of petrol and diesel burned every day in our cars, buses and trucks. [6]
It should also be noted that cars and trucks are becoming more efficient and cleaner, as on average vehicles today place a smaller burden on the environment and climate per kilometre driven than in the past – partly due to legislative regulations (emissions standards). In absolute terms, particulate emissions from traffic have fallen by 59% since 1995. Nevertheless, absolute emissions continue to rise. [7] In freight transport alone, goods volumes are expected to be up to four times higher by 2050 than they were in 2010. [2] And if we continue on our current trajectory, freight transport will be the highest-emitting sector by 2050.
Let us take a closer look at the individual freight transport modes.
Freight Transport – Road
50–60% of global freight emissions are caused by trucks. [5] That amounts to approximately 2.2 billion tonnes of CO2 per year. Germany's transport sector emitted approximately 146 million tonnes of CO2 in 2020. Within this, road freight transport accounts for around one third of CO2 emissions: approximately 48 million tonnes. [8]
In total, approximately 3,410,000 trucks are in operation on German roads. [5] The mileage driven by trucks in Germany rose from 47.8 billion kilometres in 1995 to 63.2 billion kilometres in 2022. Diesel trucks represent the overwhelming majority. [7]
The specific CO2 emissions (e.g. nitrogen oxides NOx) from road freight transport fell by around 33% between 1995 and 2018. With regard to the CO2 emissions of road freight transport, however, it is evident that the vehicle-side technical improvements in energy consumption have been more than offset by the increased transport performance. In absolute terms, CO2 emissions in road freight transport rose by 21% between 1995 and 2019 – from 39.3 to 47.4 million tonnes – despite technical improvements. [7]
Incidentally: 111,420 tonnes of microplastic particles enter the environment in Germany alone every year through tyre abrasion. [7]
Freight Transport – Shipping
Thanks to their high tonnage capacity, ships can be a comparatively environmentally friendly mode of transport. As ship size increases, transport costs per container and emissions per transported good decrease – although total emissions rise with ship size. Most cargo ships run on heavy fuel oil and without particulate filters. [5]
Shipping already accounts for approximately 2.6% of global CO2 emissions. In 2015, these amounted to approximately 932 million tonnes of CO2. [9] In 2021, around 80–90%, or 11 billion tonnes, of world trade was transported by approximately 62,100 cargo ships. [5] Shipping has thus become a key element of globalisation. Although shipping accounts for the lion's share of all international transport, it is surprisingly responsible for only 37% of transport CO2 emissions. [14]
Incidentally: Have you ever looked at what is being transported around the world by ship? Approximately 30% of the world's total deadweight tonnage (dwt) consists of oil, gas and coal. If we were to transition 100% to renewable energy, the ships transporting fossil energy sources would no longer be needed. [15]
Estimates suggest that, without counteracting policy measures, CO2 emissions from maritime shipping

Did you find this article helpful?

Technological Openness and Its Limits
On the challenges of the mobility transition between market logic, planning certainty, and political responsibility.

What Employees in Logistics Really Want
About benefits that go far beyond salary – and become the key to motivation and retention.

Employee Benefits in Logistics
Which employee benefits beyond salary really make a difference.

Leadership in Modern Logistics
Living and passing on growth – an interview with Lorena Garcia from AUTODOC.